Asset (device) lifecycle states
Asset states
An asset can be in one of the following states:
- Active: The device is actively reporting in. For devices running the agent directly, the last heartbeat (Last activity) is within 24 hours. For devices managed through a collector (or child devices), the last connection is within 36 hours.
- Inactive: The device has not reported in within the active window (24 hours for agent devices, 36 hours for collector-managed devices) but has not yet reached the auto-archival period (default 7 days).
- Pending Archival: The device belongs to an asset class configured for "Manual Archival Only" and has been inactive past the auto-archival period (default 7 days). It is flagged for archival and waits for manual confirmation before being archived (see the archival policy). Until it is confirmed, the device returns to Active if it checks back in.
- Expired: The device has been archived because of extended inactivity. This happens automatically (default 7 days) for asset classes configured for automatic archival; classes set to "Manual Archival Only" become Pending Archival instead and are archived only after confirmation. (see this article for more details on this)
- Stale: The device is inactive (i.e., has not reported in for more than 24 hours) but is still being seen by other devices on the network.
- Decommissioned: The device has been decommissioned in Nanitor. This means it is no longer in use and is hidden from reports.
- Ghost: The device has been decommissioned but is still checking in to Nanitor, meaning it is still running the Nanitor Agent. This means the device likely has not been properly wiped of company data.
-
Rogue: The device has been identified on the network by MAC address and subnet IP but is not under monitoring in Nanitor. Rogue devices are only discovered if the Network Discovery feature is enabled.
- If that rouge device is not detected again through network discovery it will be archived after 7 days, at which point it will show up as “Expired“ in the UI. The confusion that can happen here is that in the UI archived is referred to as expired.
These are the other states a rouge device can transition into:
- Active
-
If the rouge devices is signed up to Nanitor it will be unrouged, making it active
-
Decommissioned
- If the device is manually decommissioned through the UI
- Undiscovered: Nanitor has been told about the device, by uploading a CSV file, but it has not been discovered by Nanitor.
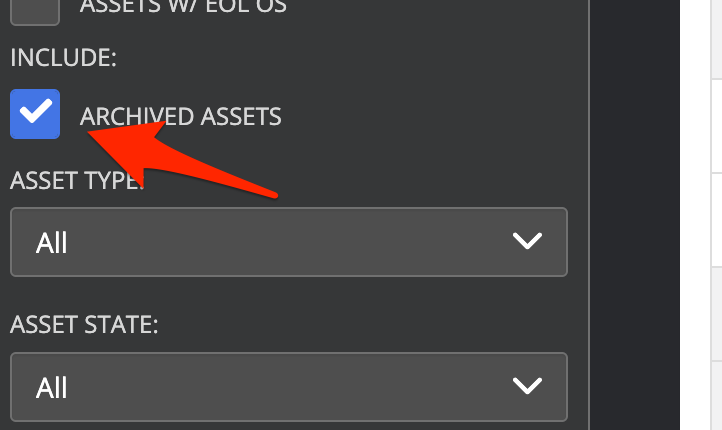
The expired and decommissioned asset states will not be shown (and assets in those states will not be shown in the asset list) unless the “Include archived assets” box is checked!
Asset dates
Assets report into Nanitor in various ways, either by sending a heartbeat, checking in for reporting on changes, or when the asset has been seen by other devices if network discovery is turned on. You can view these dates when hovering over the information icon next to the asset state. This helps to understand and troubleshoot assets that are in a different state than expected.
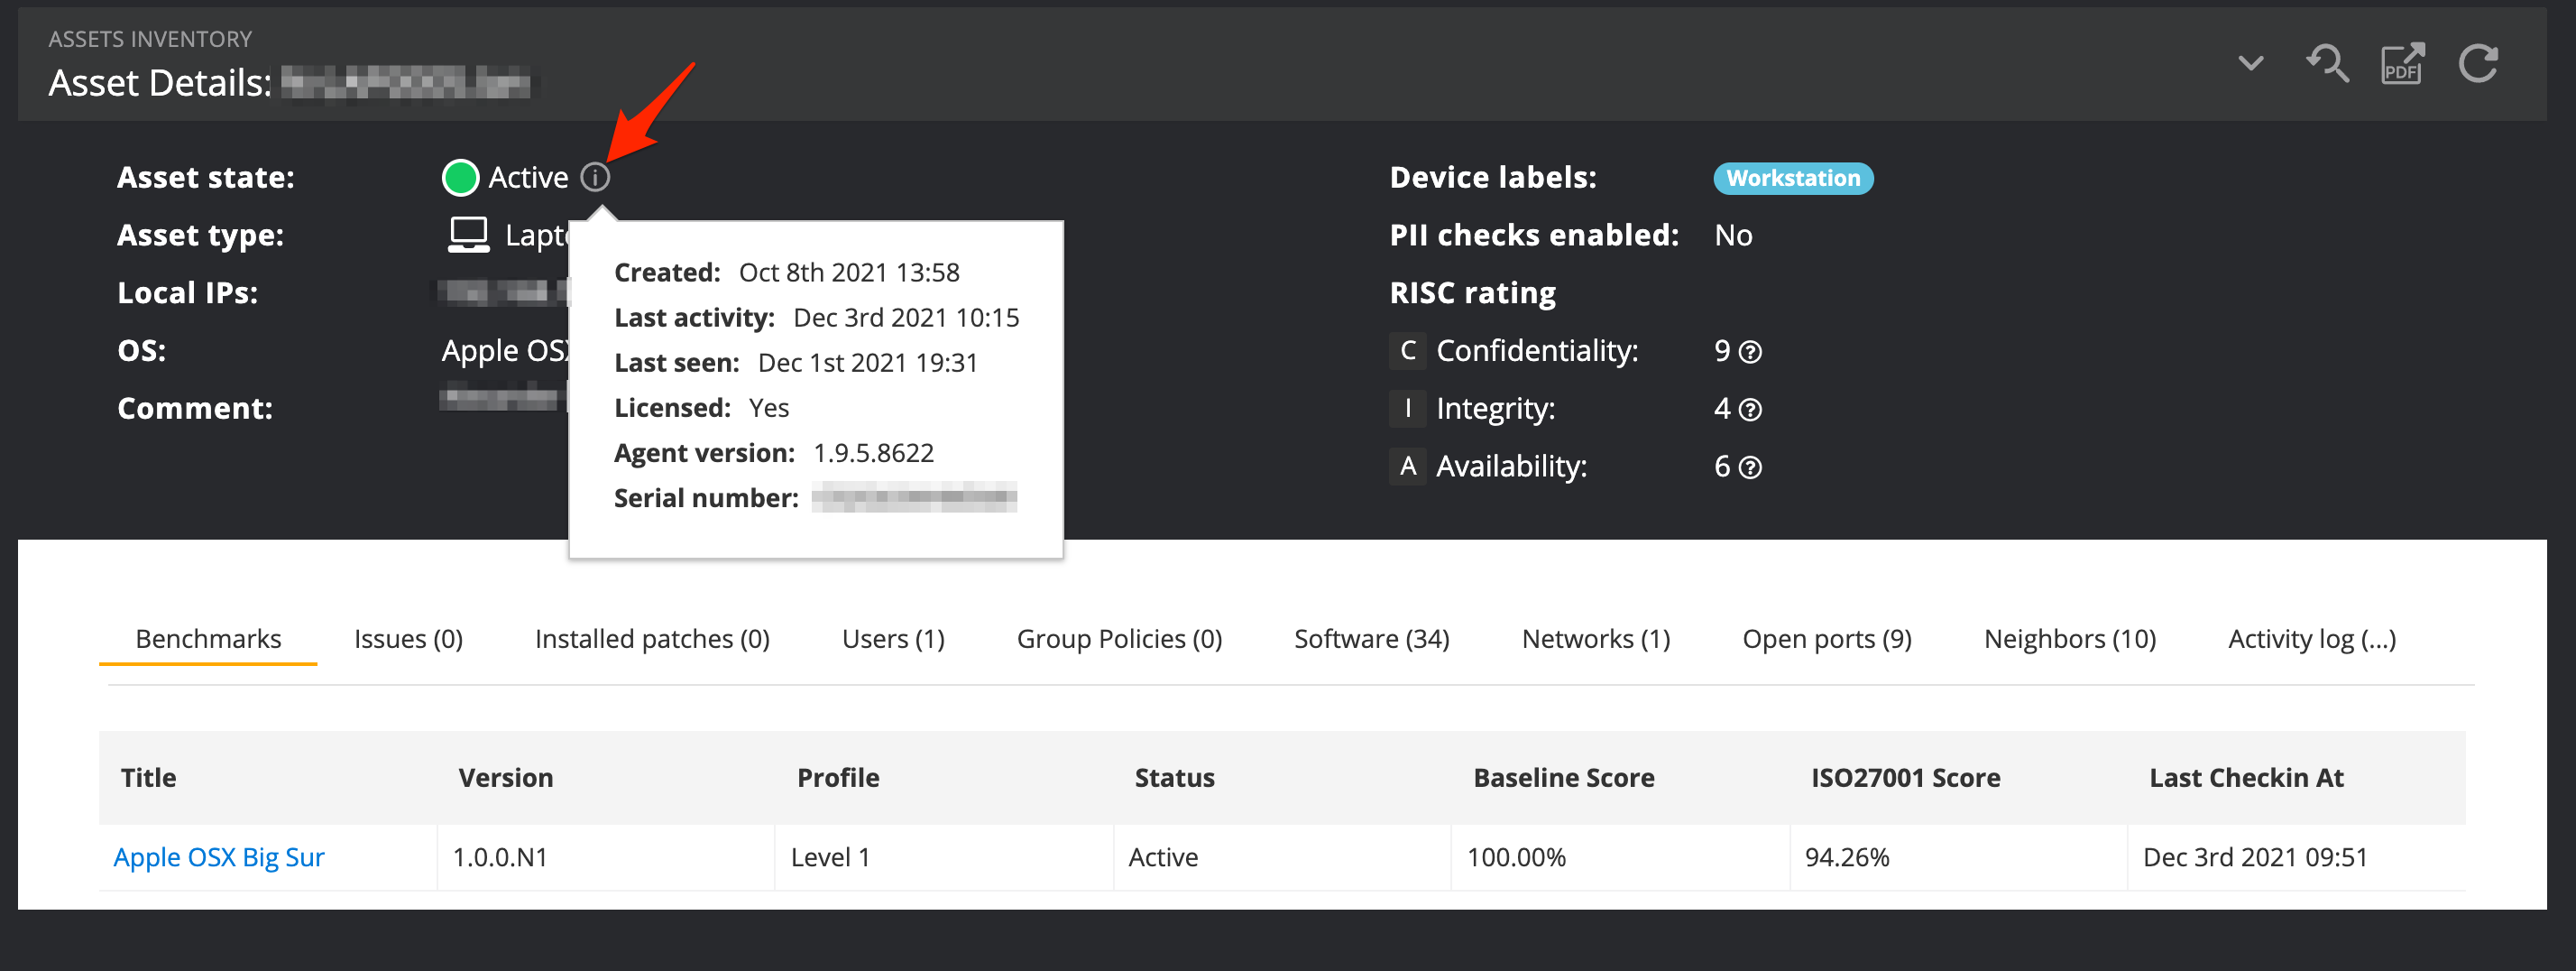 The dates shown in the asset detail page are:
- Last activity is the date/time when the last heartbeat was received
- Last seen is the date/time when another asset discovered this asset on the network. This is visible only when the network discovery feature is enabled.
- Last check-in is the date/time of the last check-in for the benchmark (shown in the benchmark table below).