Dashboards
Dashboards:
Nanitor implemented a dashboard to display key information gathered in Nanitor. The dashboard has been implemented in Version 2.1.2. The available dashboards can be accessed from the main menu (Overview)
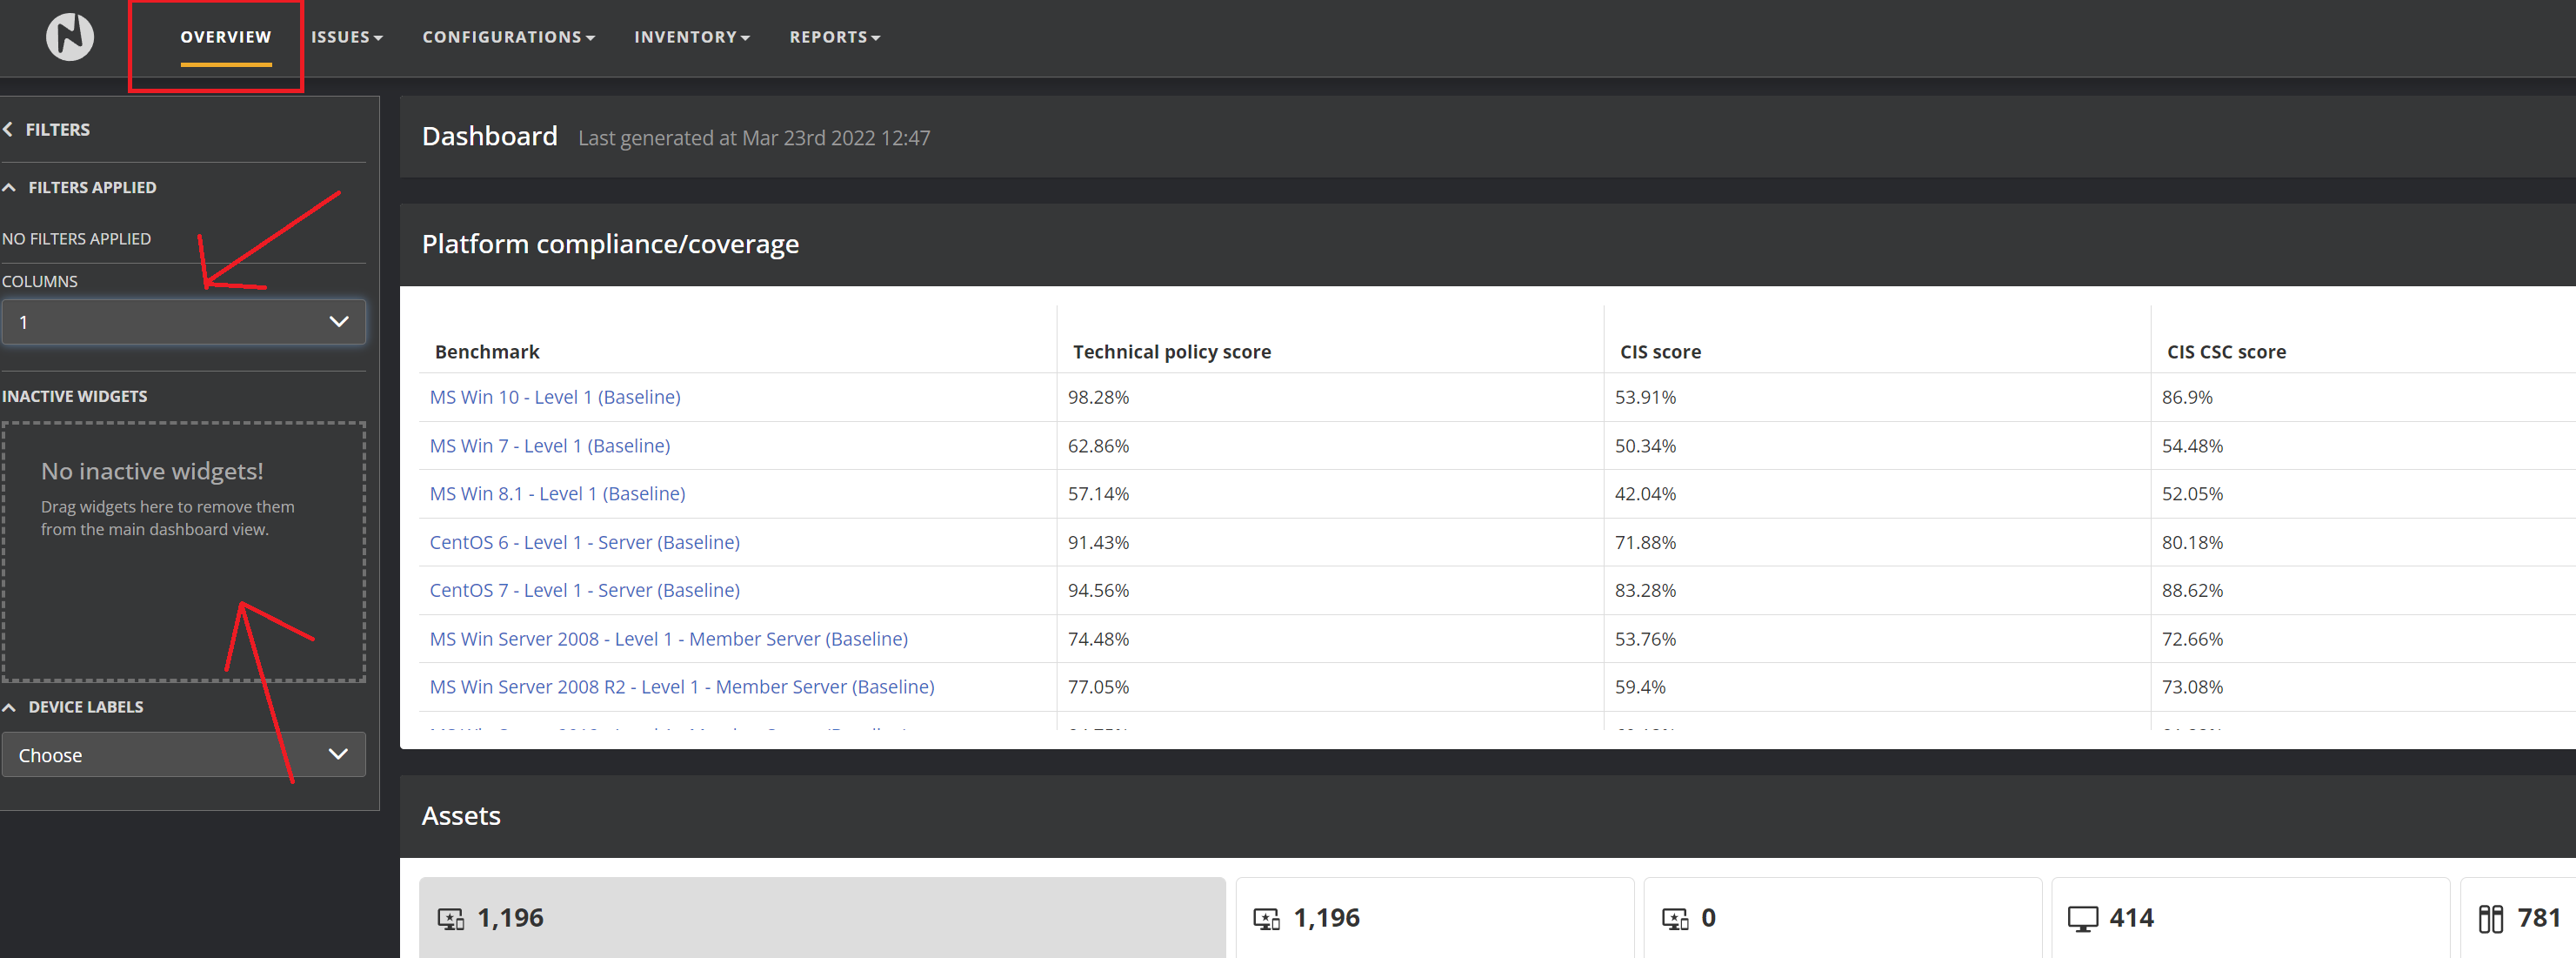
The dashboard contains a couple of preconfigured widgets that can be placed on the dashboard by dragging and dropping the widget on the dashboard. Dashboards can be visually organized in 1, 2, 3, or 4 columns (Depending on the width of the screen - if you have a widescreen but shrink the window, you’ll get fewer columns). All changes to the dashboard affect all users. Dashboards can be managed by Nanitor administrators only.
Most of the widgets are interactive. They will navigate you to the representative page in Nanitor for investigating the presented key figures in more detail.
Available widgets:
Various widgets can be placed on the dashboard.
Platform compliance/Coverage
The platform compliance report and coverage rate widget show some key score values per benchmark:
- Technical policy score - Same as the benchmark score as documented here.
- CIS score - The total score on all rules defined in the CIS benchmark.
- CIS CSC score - The score on rules defined to be part of the organization’s primary compliance framework, CIS CSC is one compliance framework.
- Asset coverage. The asset coverage shows the amount of tracked devices for a benchmark with an agent or collector towards the total amount of assets available. The amount can be different (lower) than 100% when assets have been added to Nanitor from a csv import.
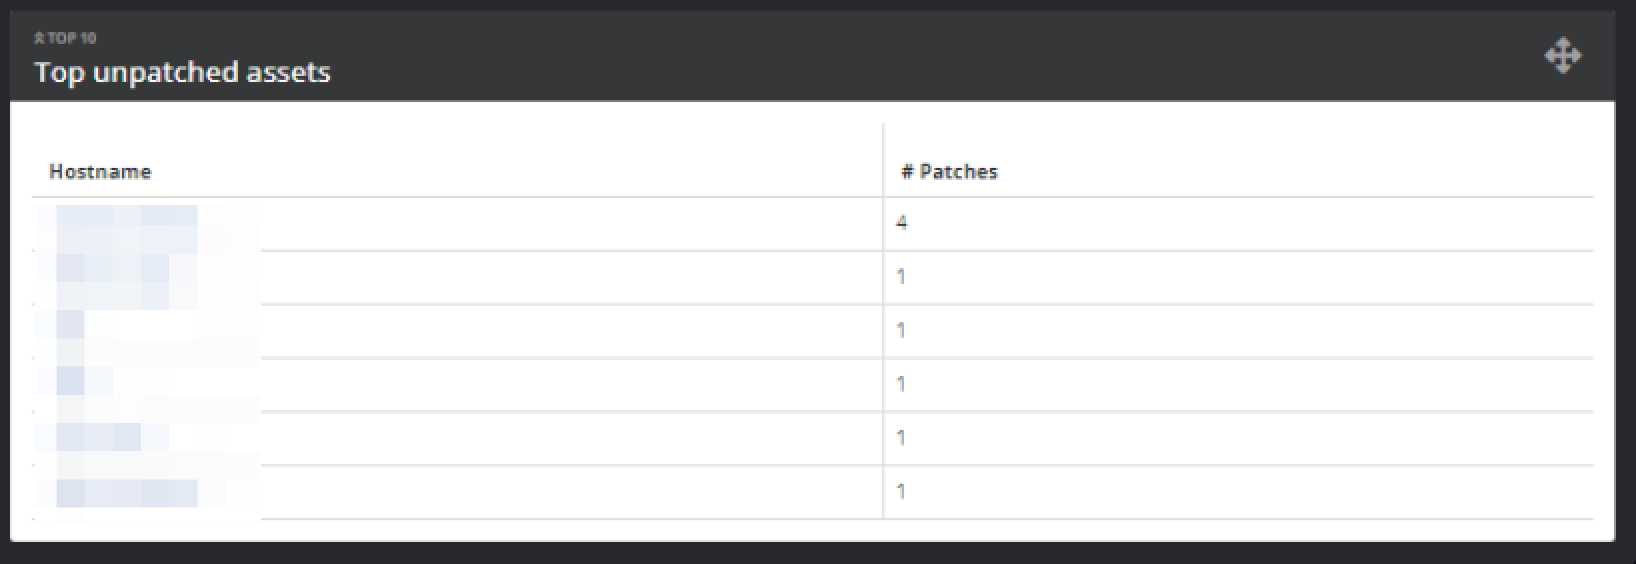
Top unpatched assets
A top 10 list of assets with the most outstanding patches.
Internal vulnerabilities
A list of vulnerabilities per asset label, per criticality, and per operation systems.
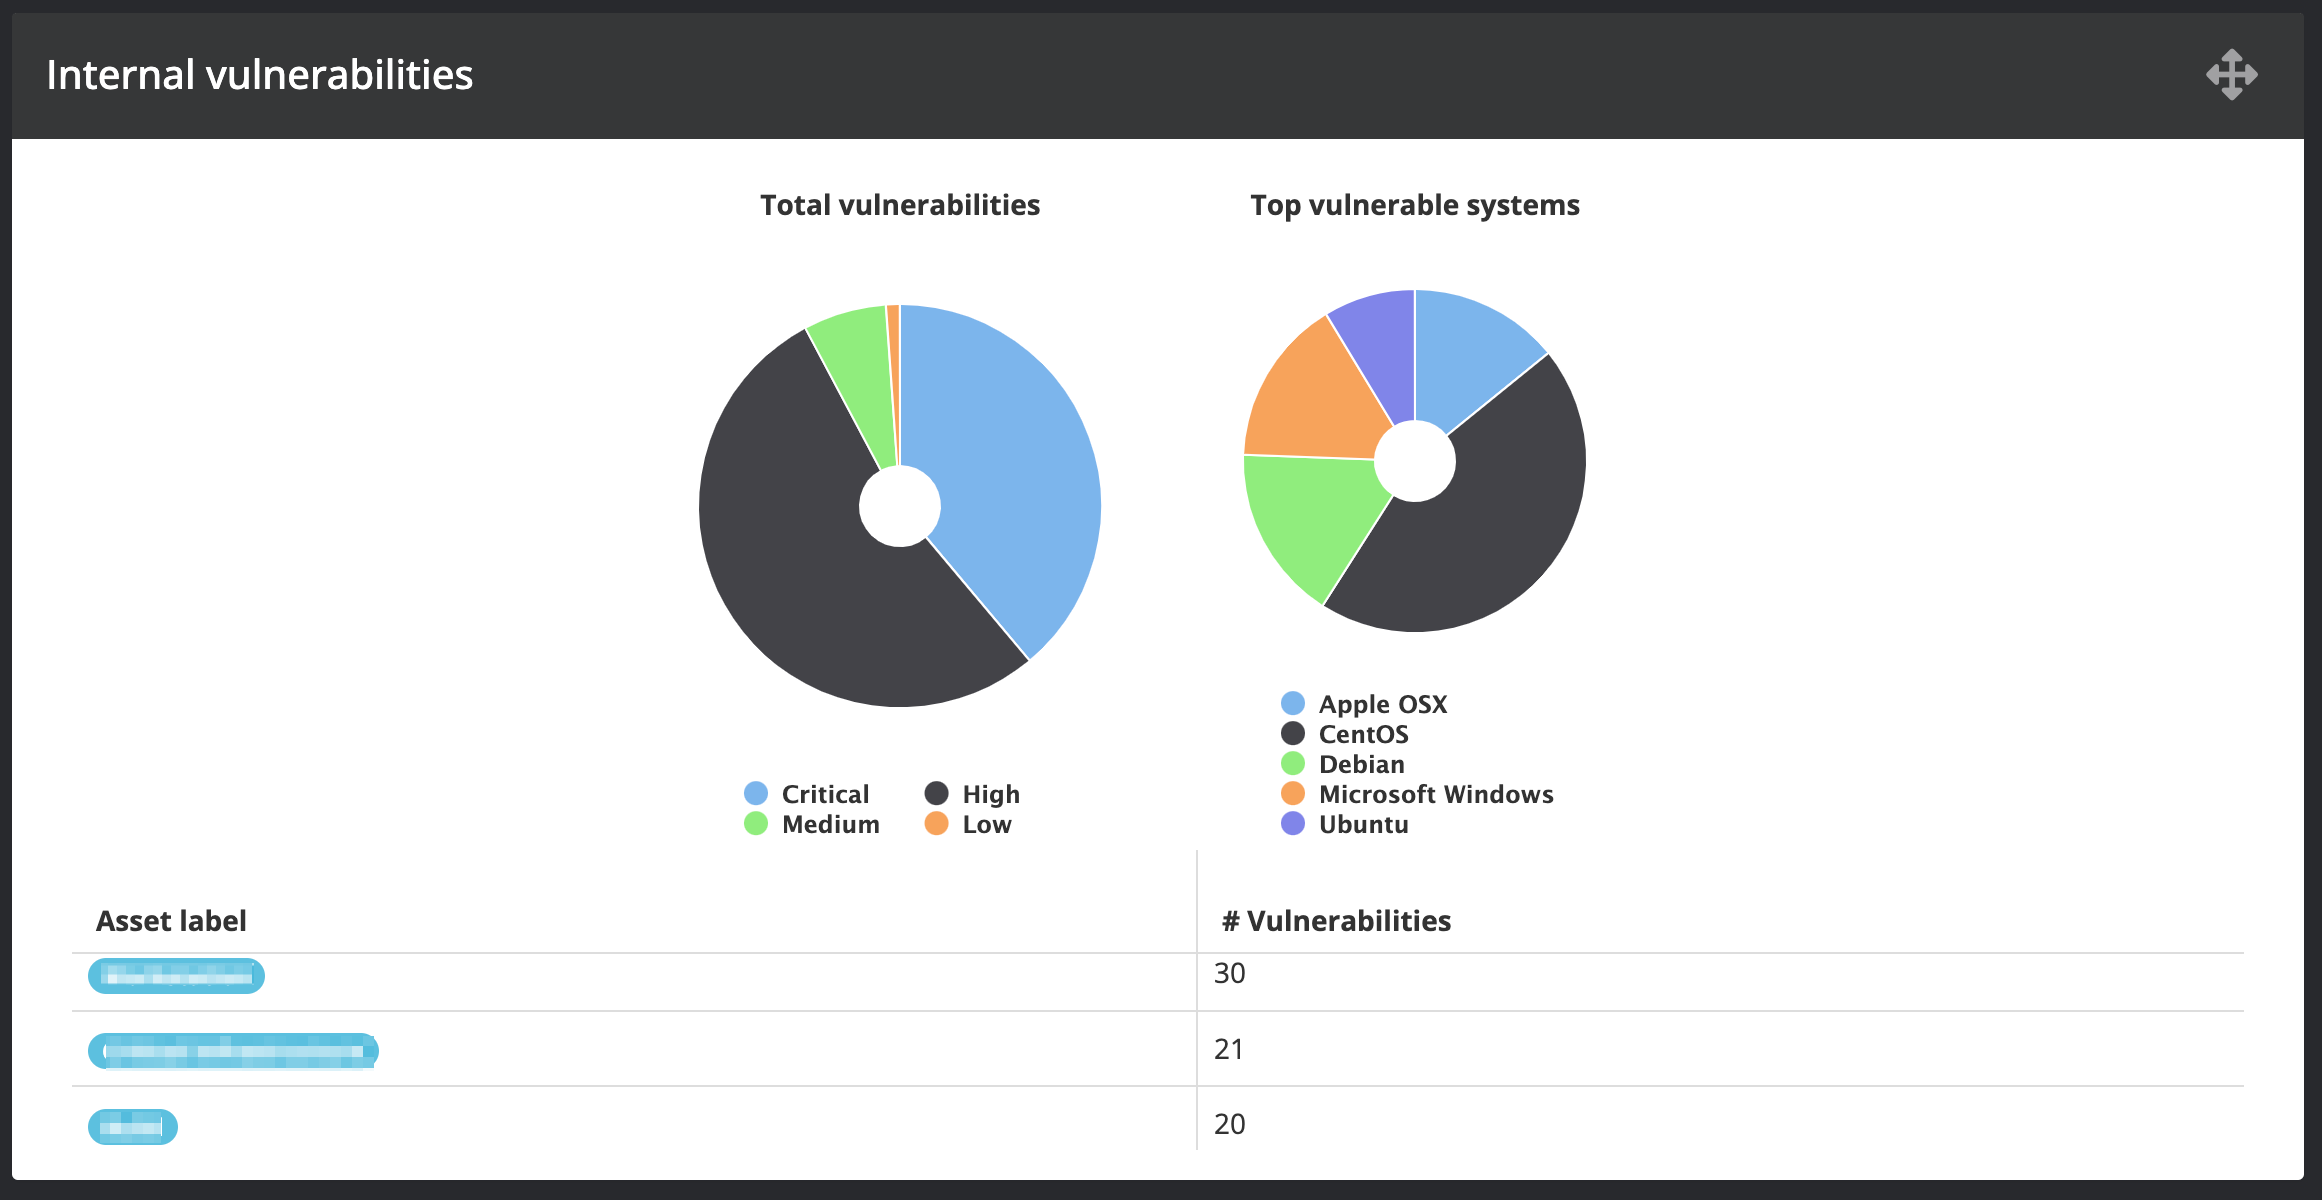
The severity of the vulnerability is defined as:
Critical: When the CVSS score is 9.0 or above. High: When the CVSS score is between 7.0 and 8.9. Medium: When the CVSS score is between 4.0 and 6.9. Low: When the CVSS score is between 0.1 and 3.9.
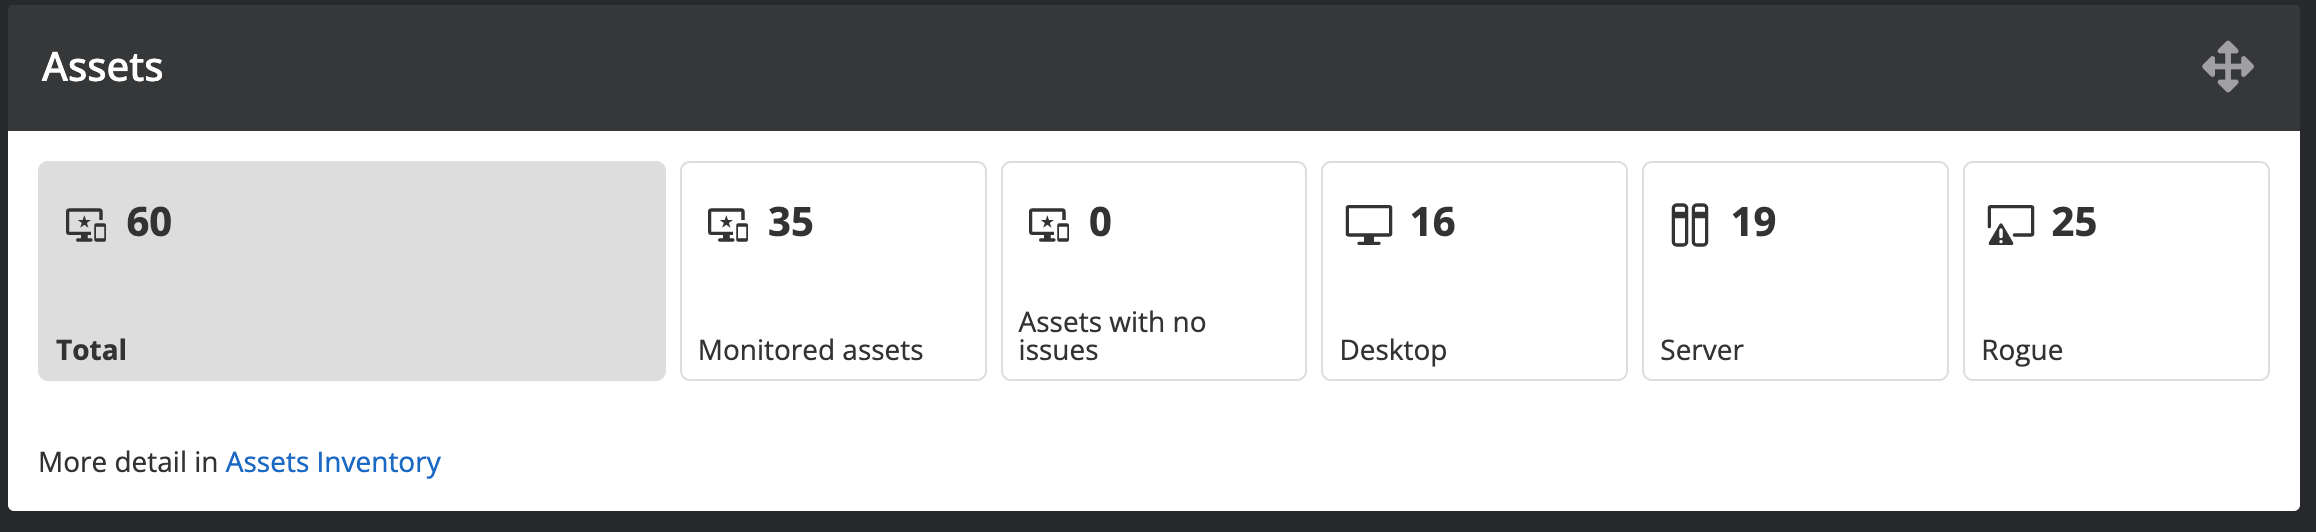
Assets
A quick overview of the number of assets per type. The widget shows the total of the monitored assets. Monitored assets have an agent installed or are feeding information to Nanitor from a collector.
Users
A list of users logged into assets.
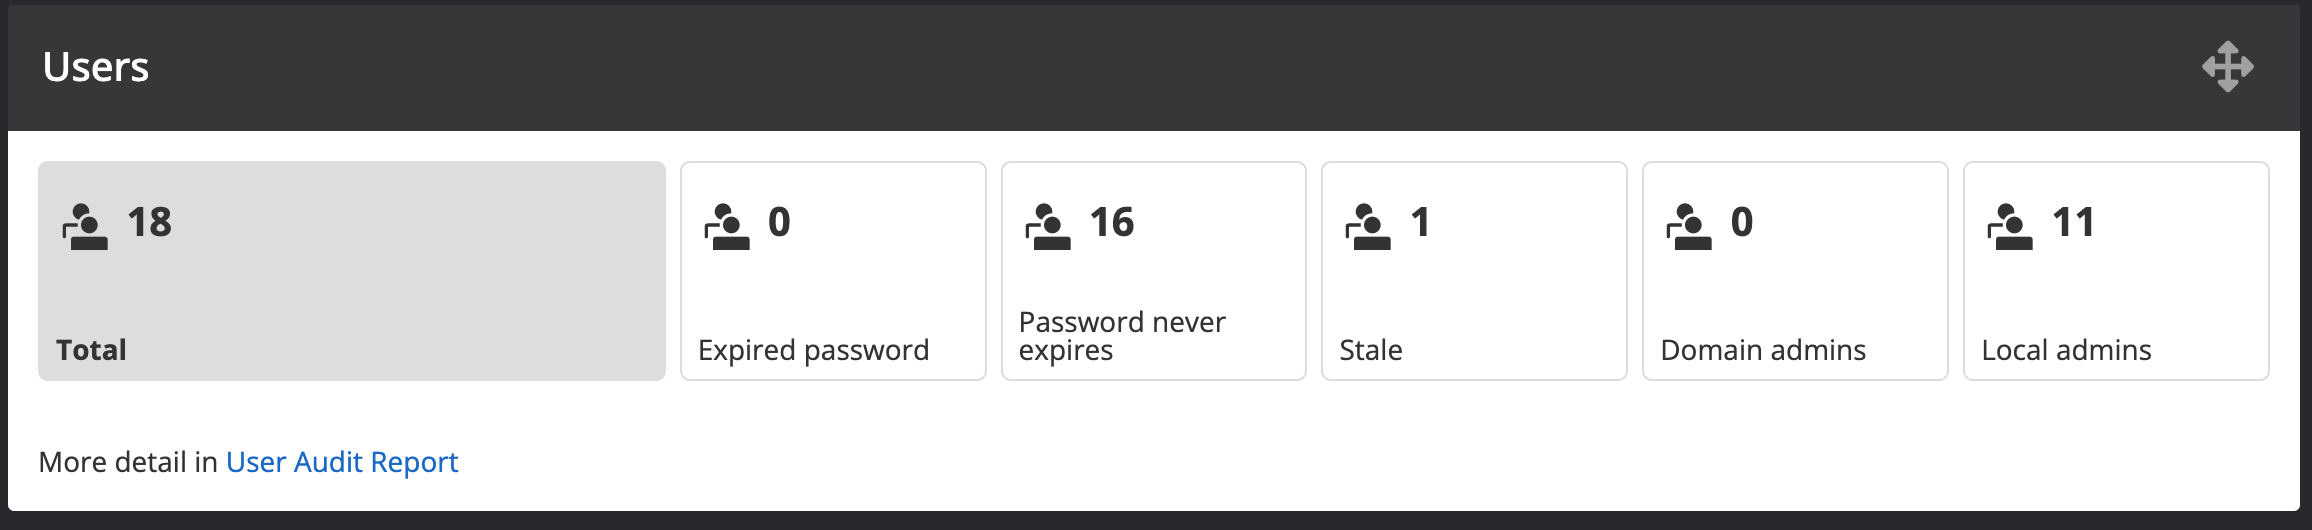
The user accounts are based on the user audit report checking for:
- Users with an expired password
- Users that have a password that never expires
- Stale users
- Domain administrators
- Users with a local administration privileges
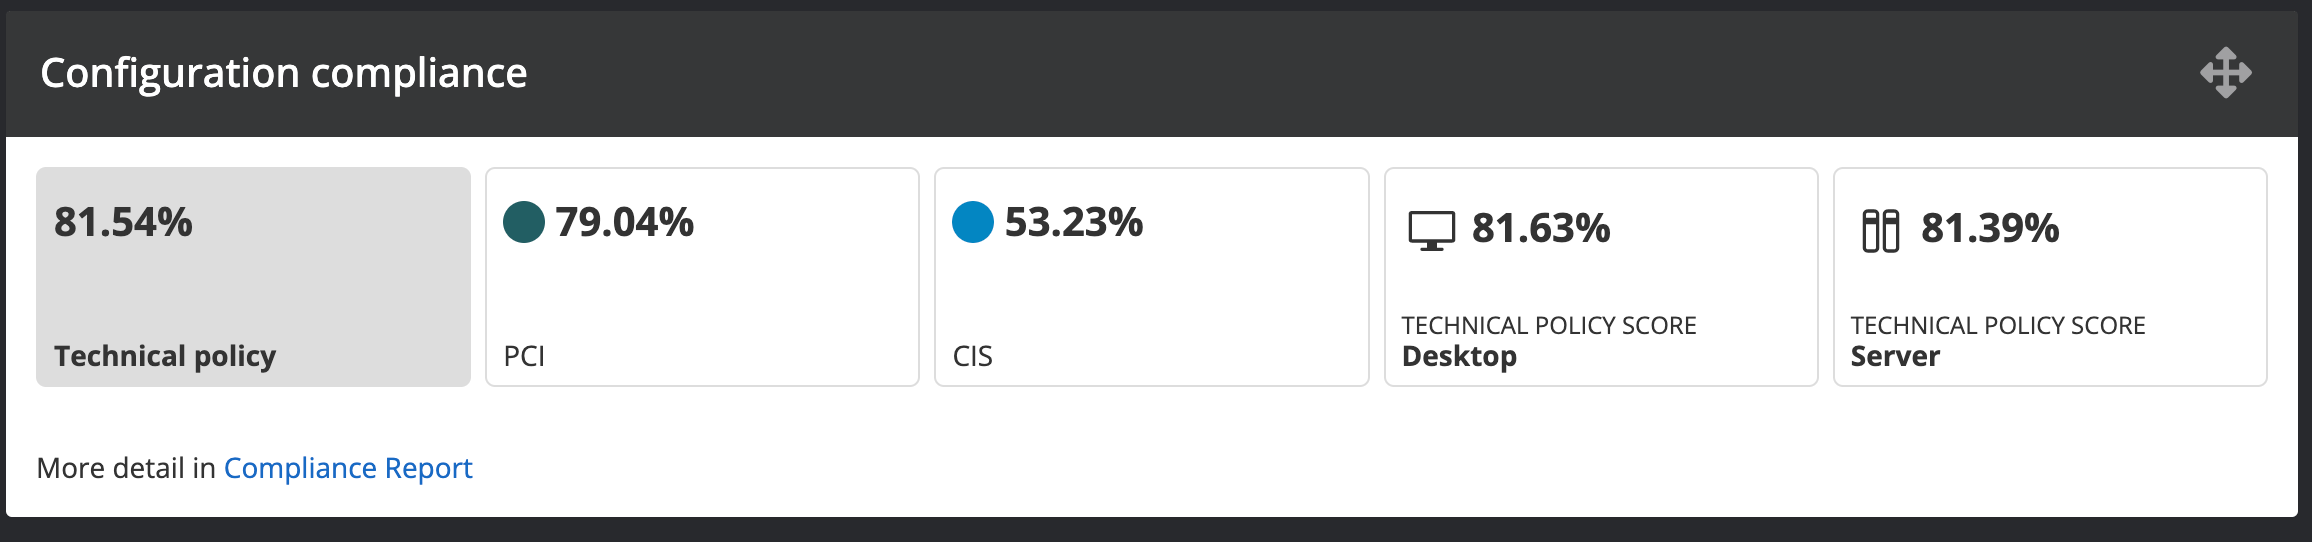
Configuration compliance
The configuration compliance widgets show an overall scoring across all benchmarks.
In detail these are
- Technical policy score
- PCI score
- CIS score
- Technical policy score per asset type available
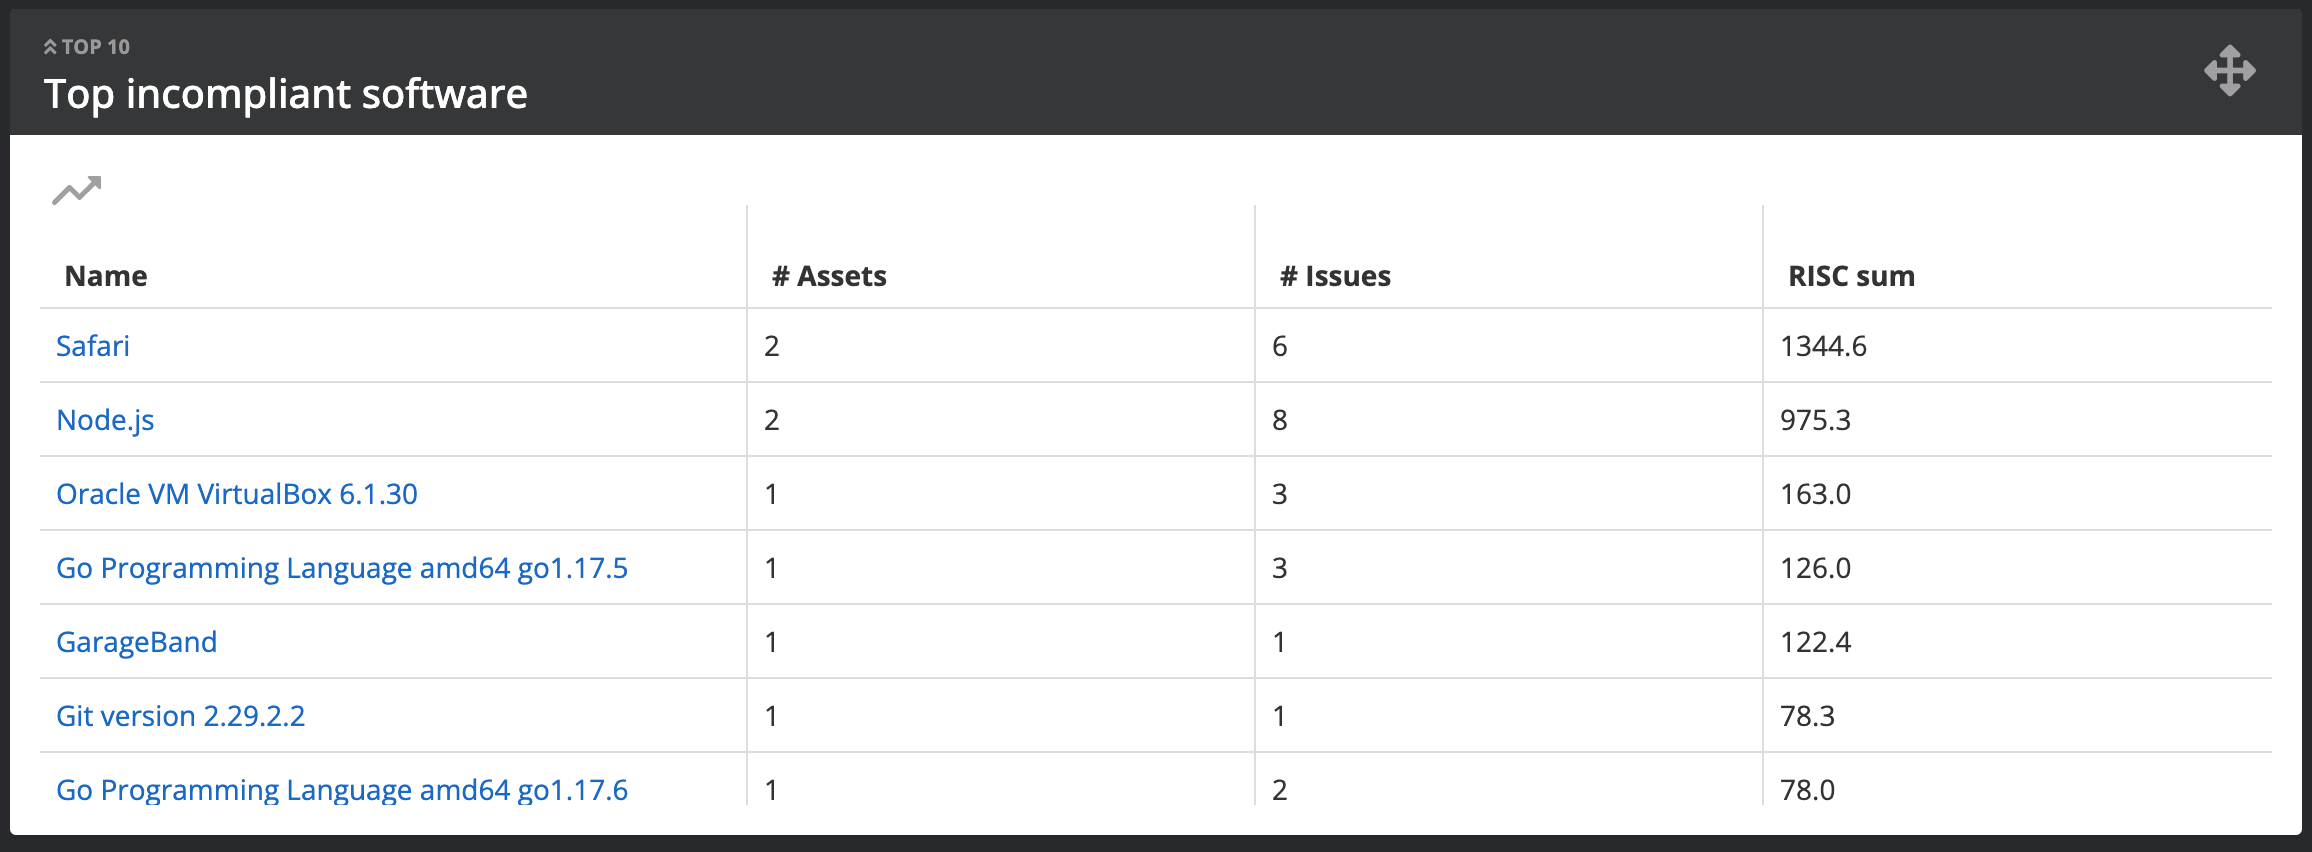
Top incompliant software
The top incompliant software widget shows the software titles with the highest sum of the priority score. The size of the bubbles is determined by the sum of the detected issues and their priority score per asset.
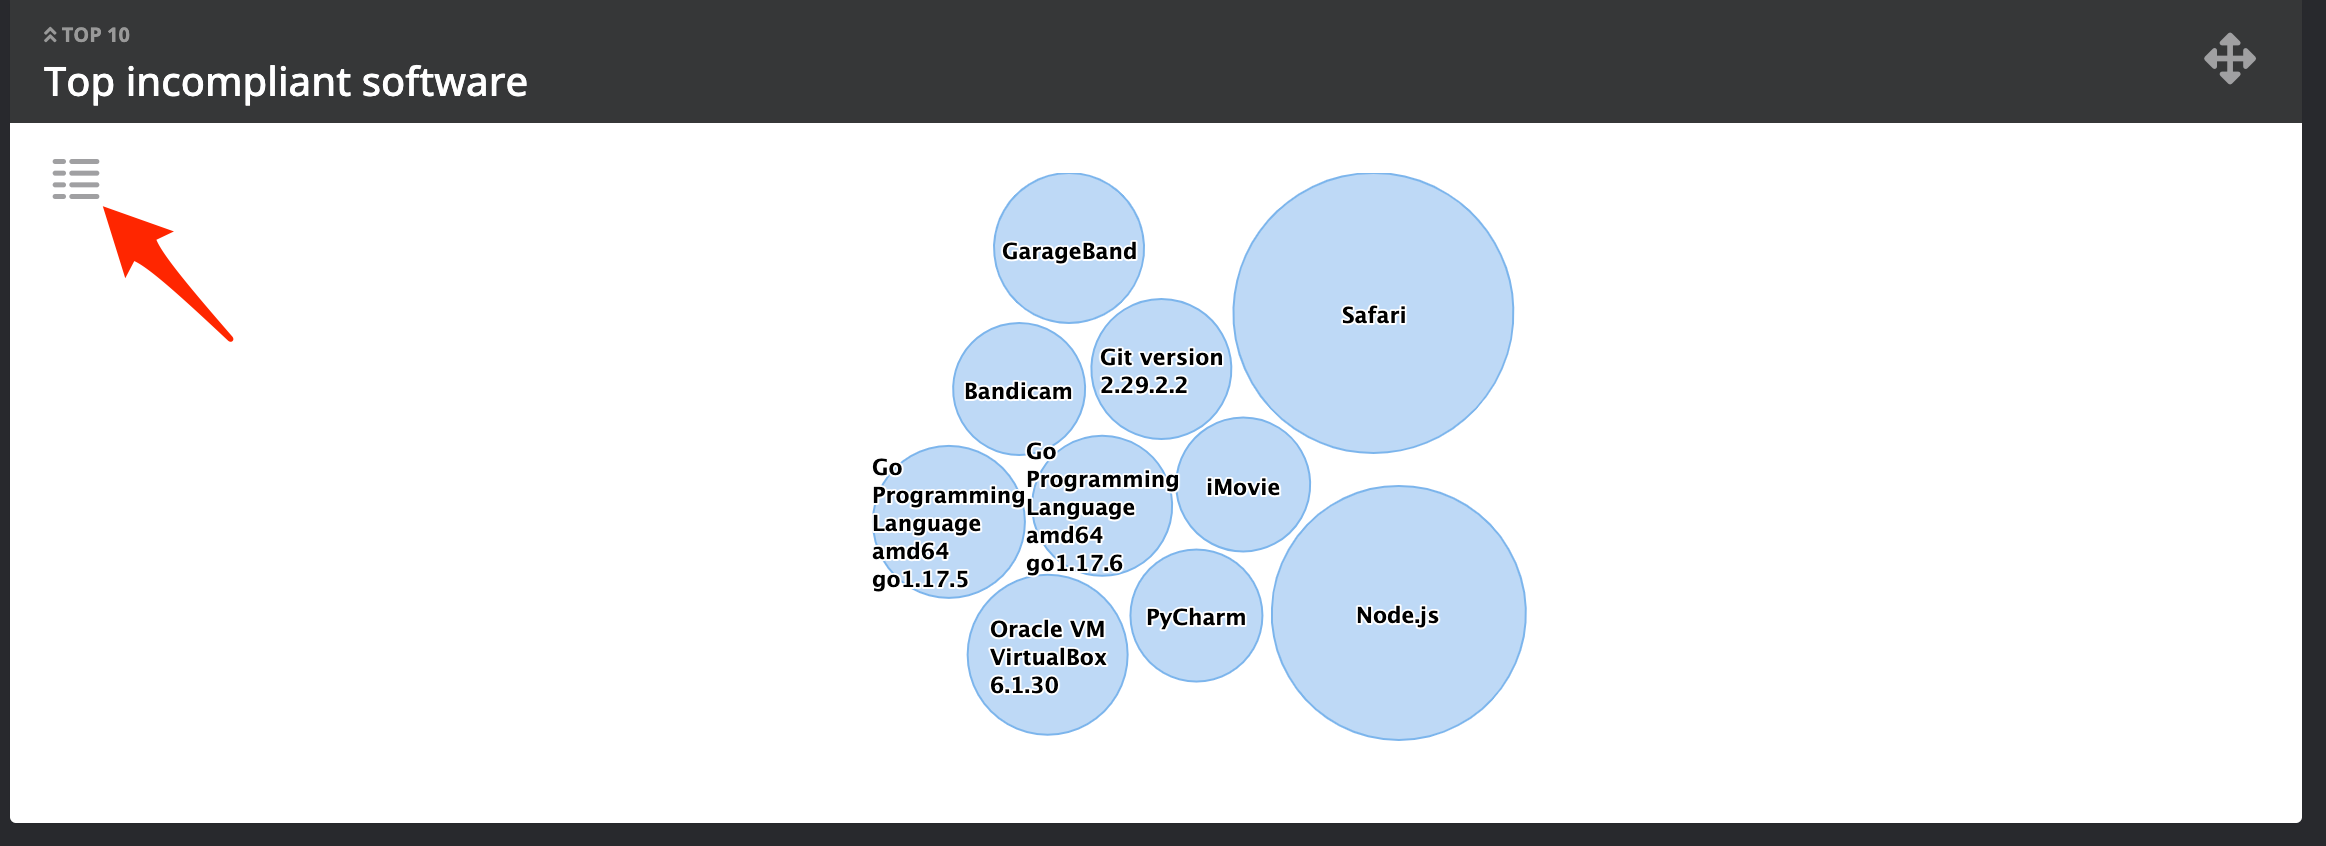
The widget can also be displayed in the list view by toggling the menu/chart icon on the top left.
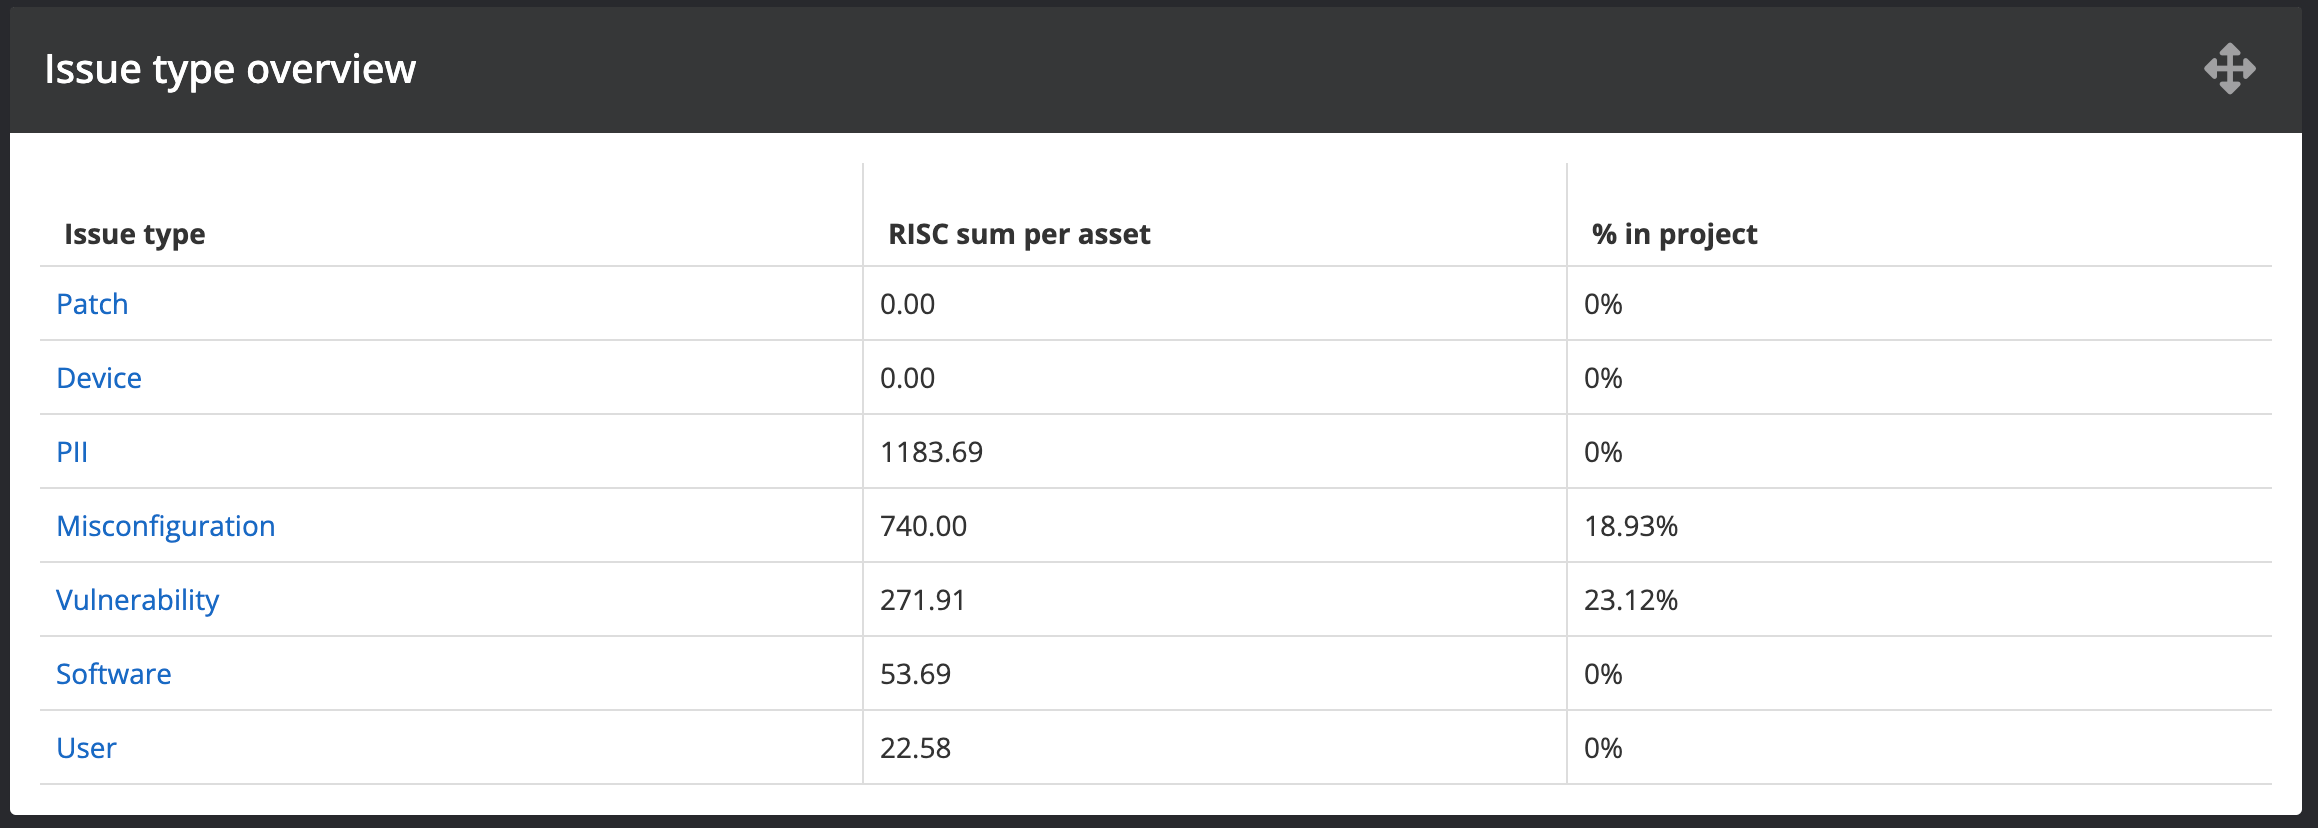
Issue type overview
The issue type widgets present the priority sum per asset (The total priority sum divided by the number of assets with detected issues). It also shows how many of the detected issues are assigned to a Nanitor project.
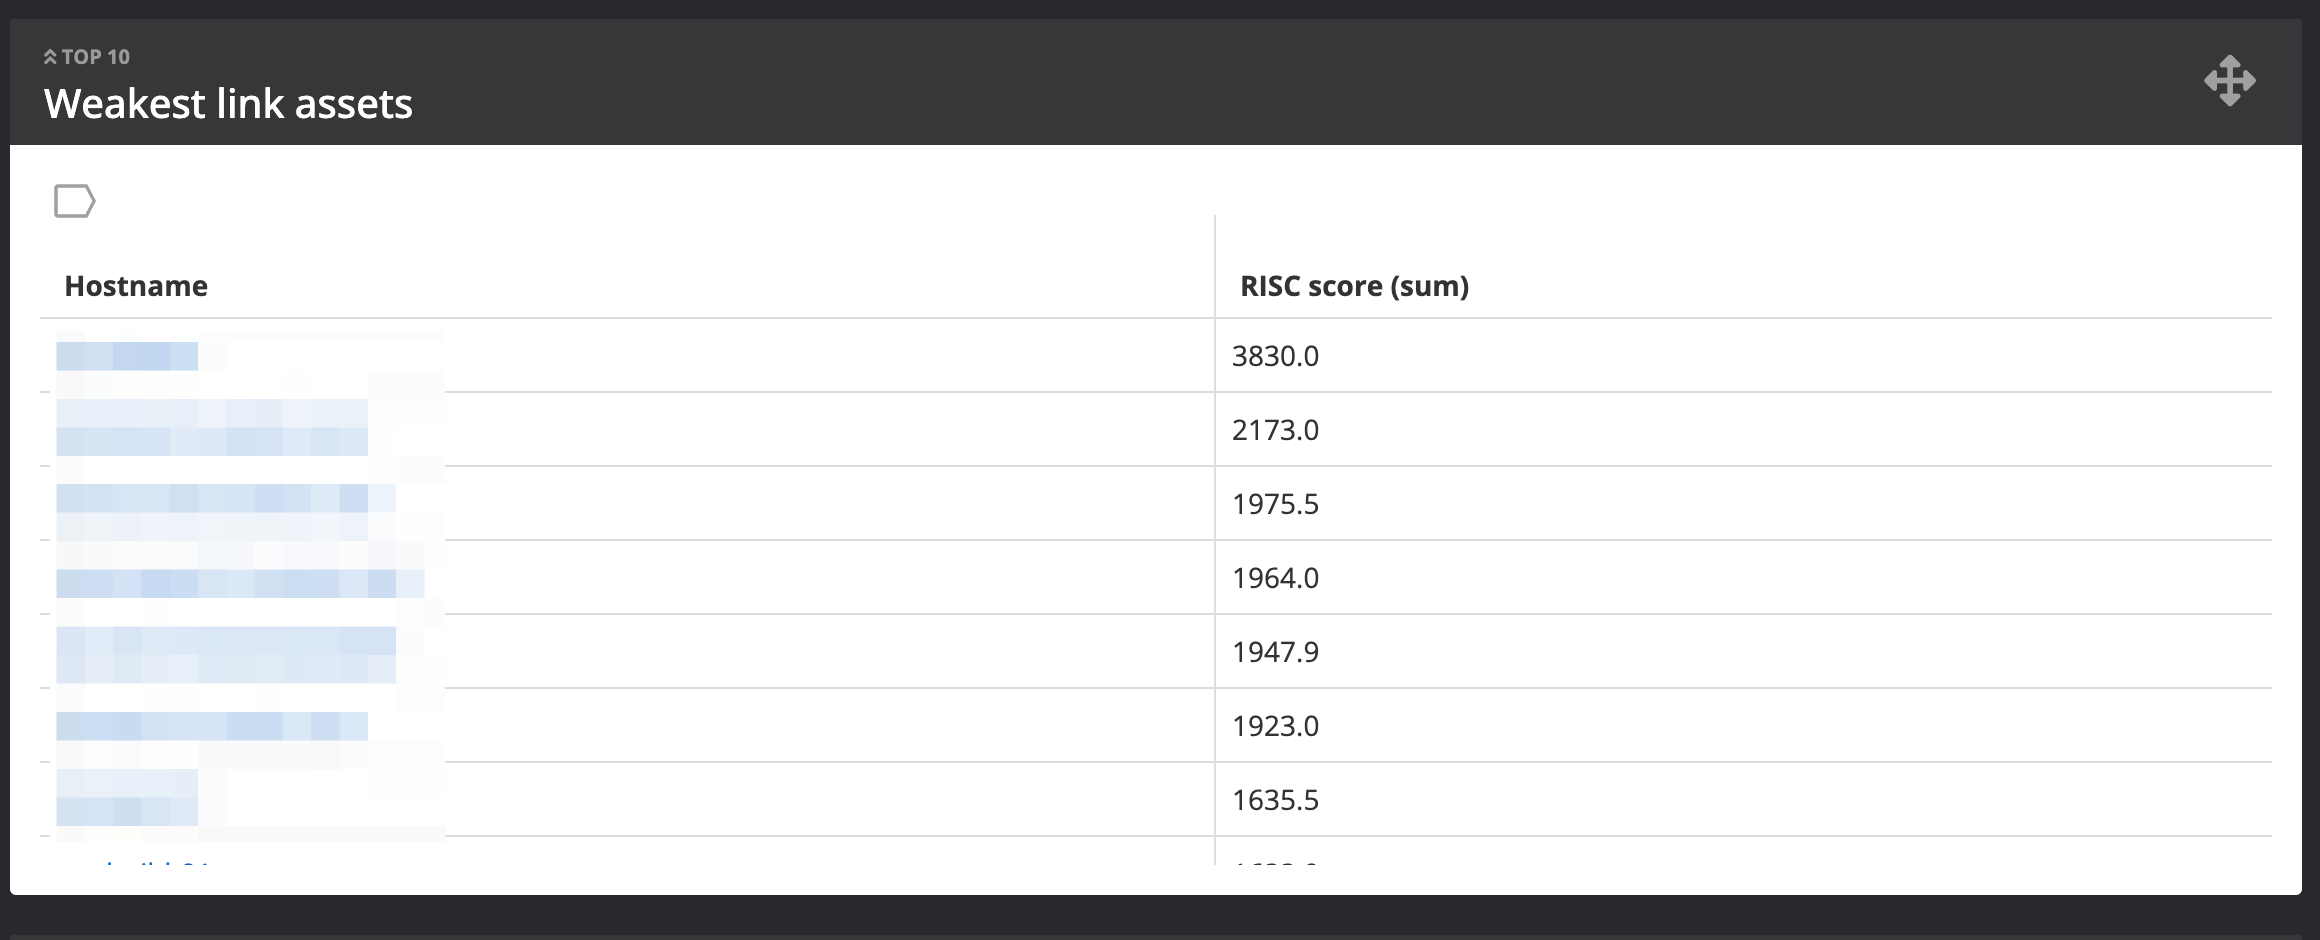
The weakest link
The weakest link widget shows a top 10 list of assets with the highest priority score which is the sum of the priority score of all issues detected on the asset. The weakest link is considered to present a list of assets that need a quick remediation solution.
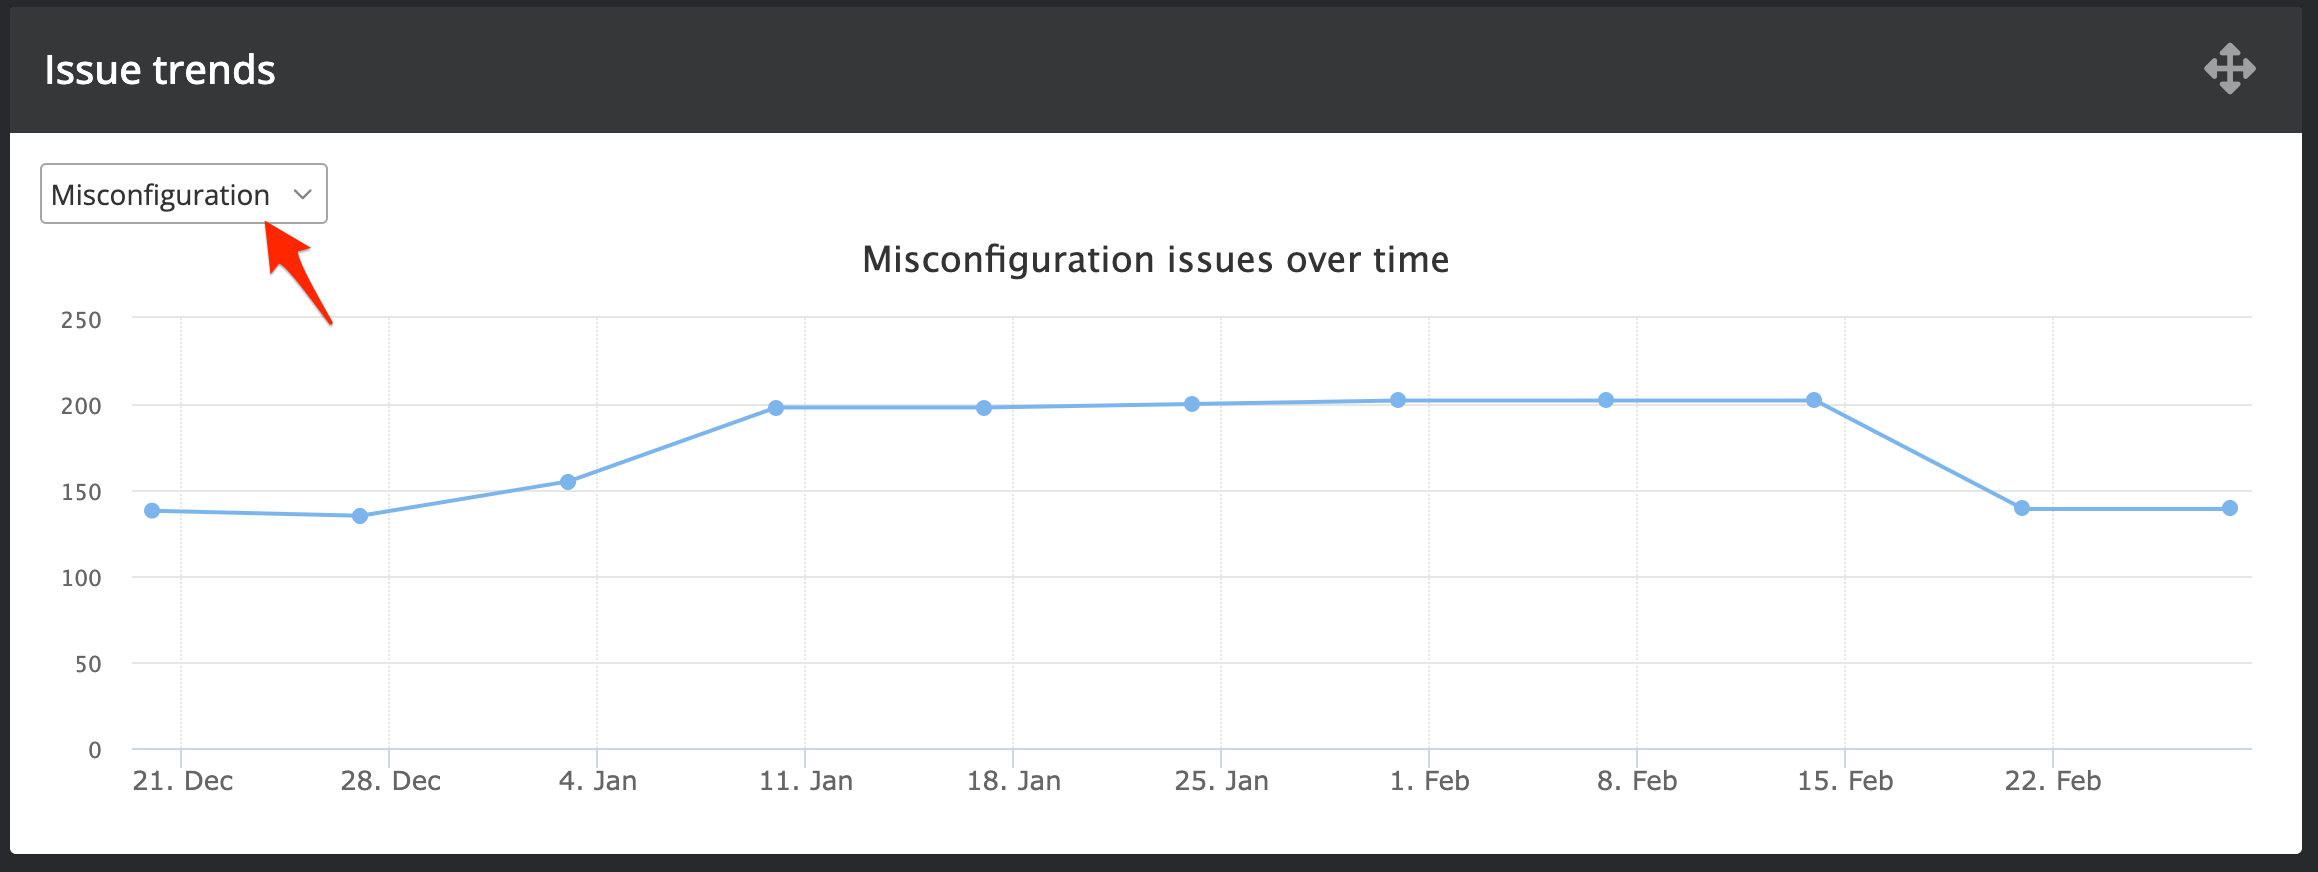
Issue trend
The issue trend chart shows the number of issues discovered by Nanitor over the last two months. From the dropdown menu on the top left you can choose between looking at the total number or breaking it down by issue type.
Label security
The label security report shows the security configuration, major issues, and installed mandatory software per label.
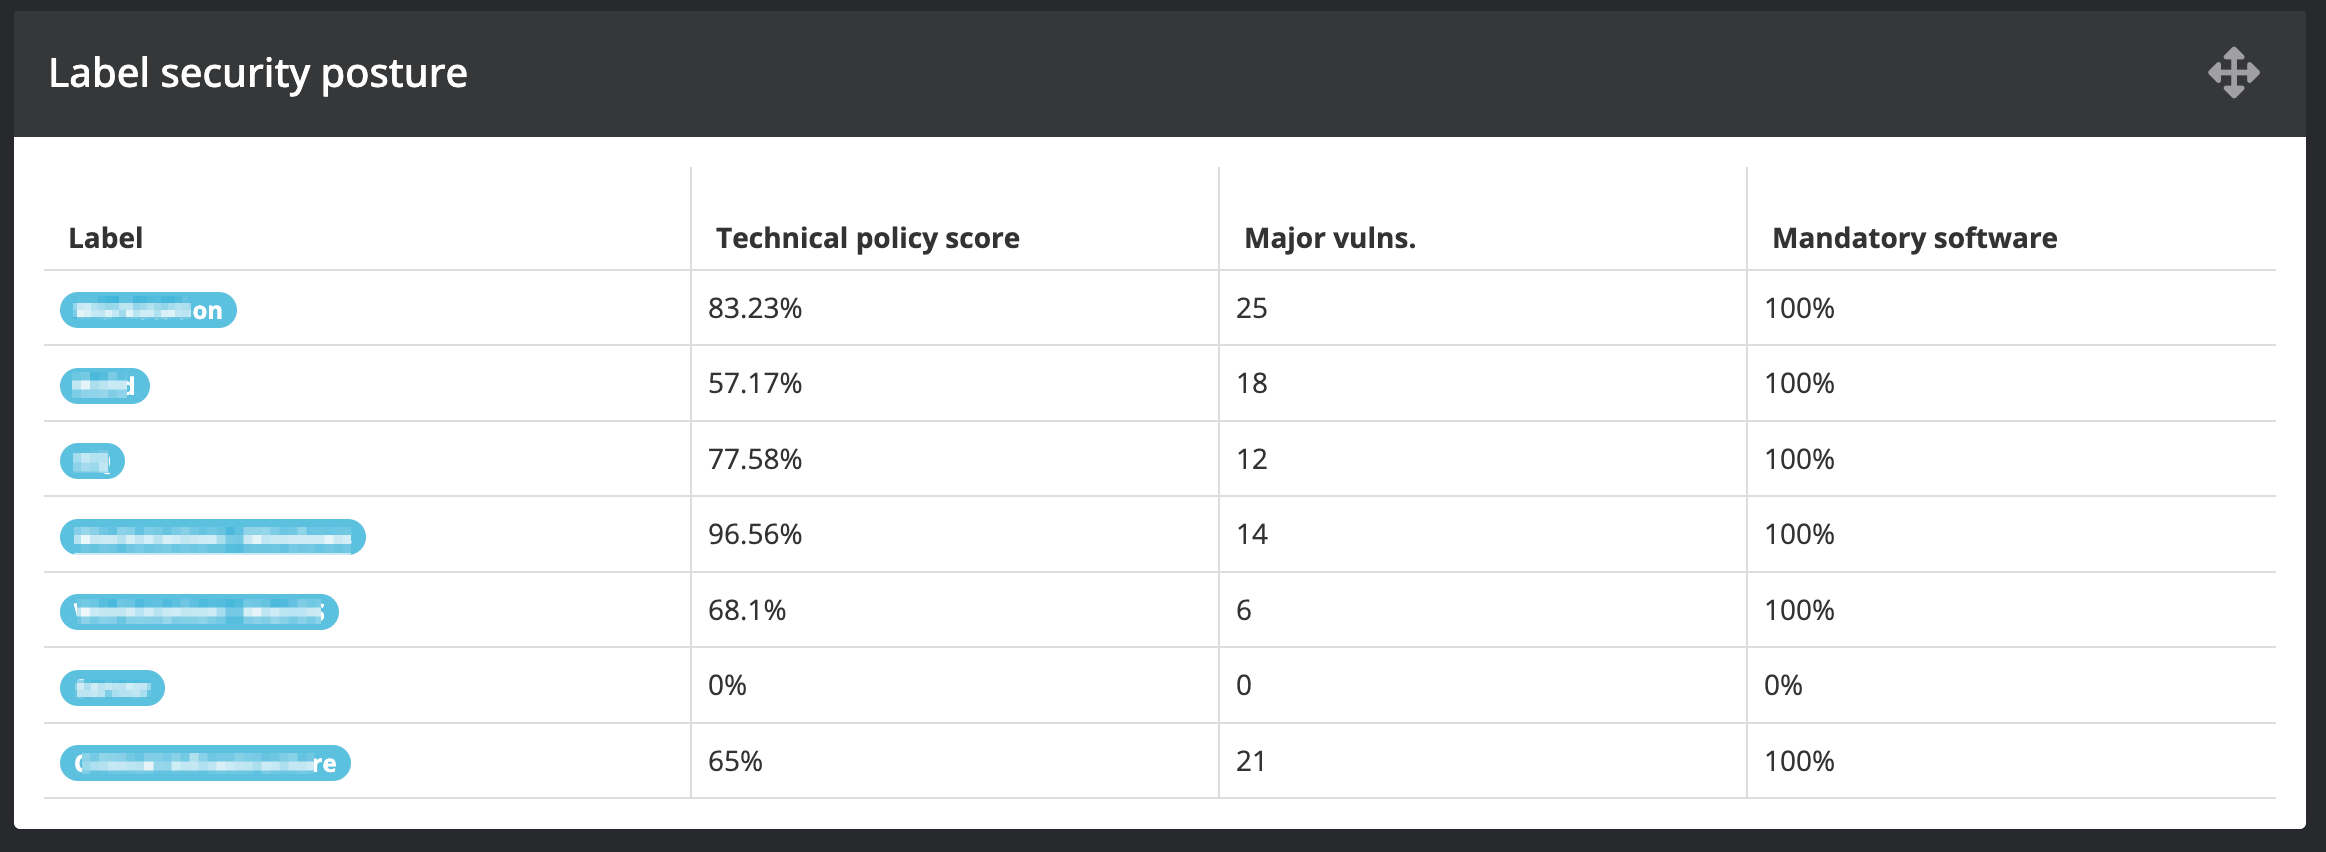
- The technical policy score is the benchmark score for the asset label
- Major vulnerabilities are issues that have a CVSS score >= 7.0 (High or Critical)
- A percentage of the mandatory software titles installed on the assets
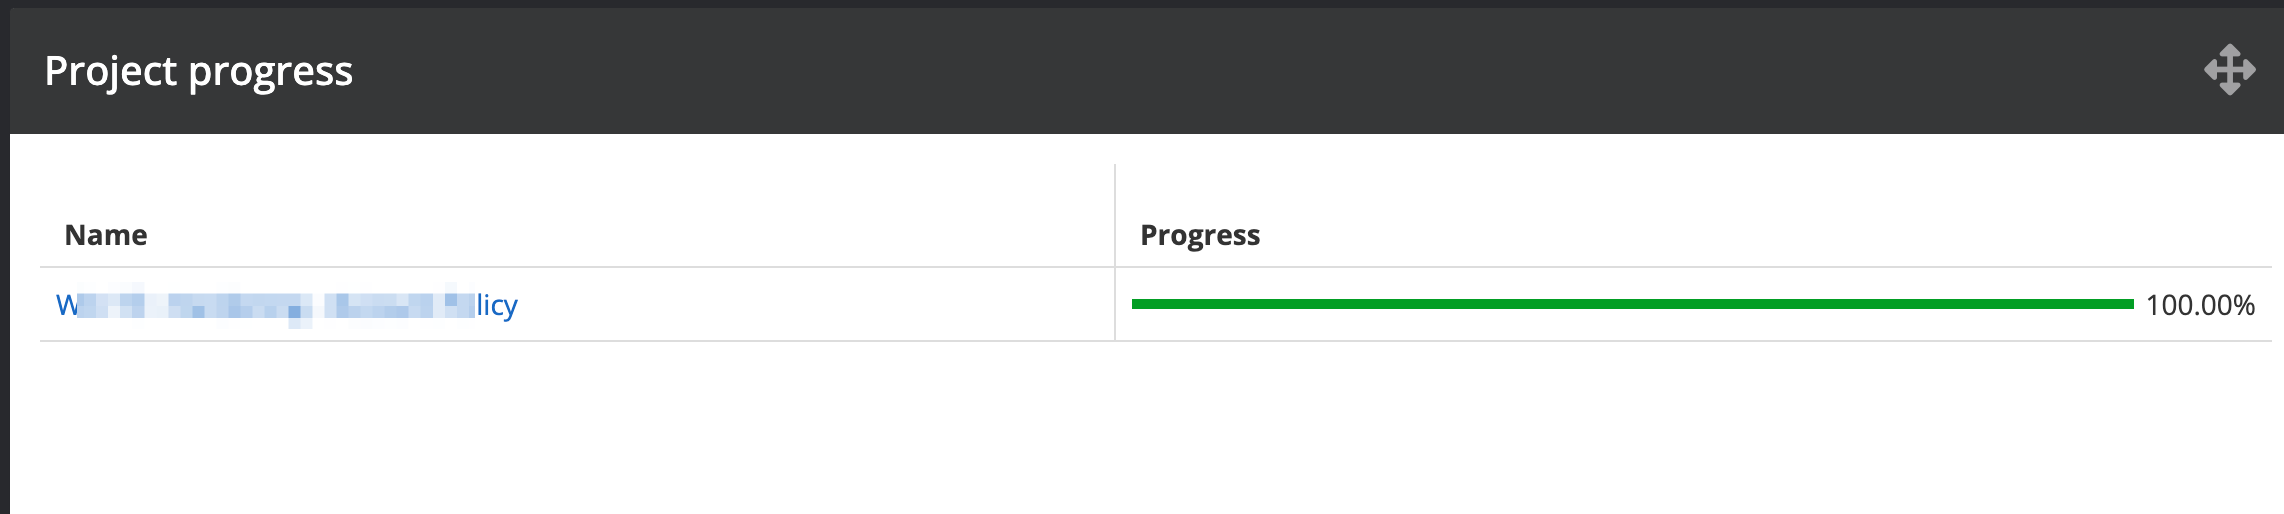
Project progress
The project progress widgets show all running projects (with an end date that is greater than the current date) and their progress.
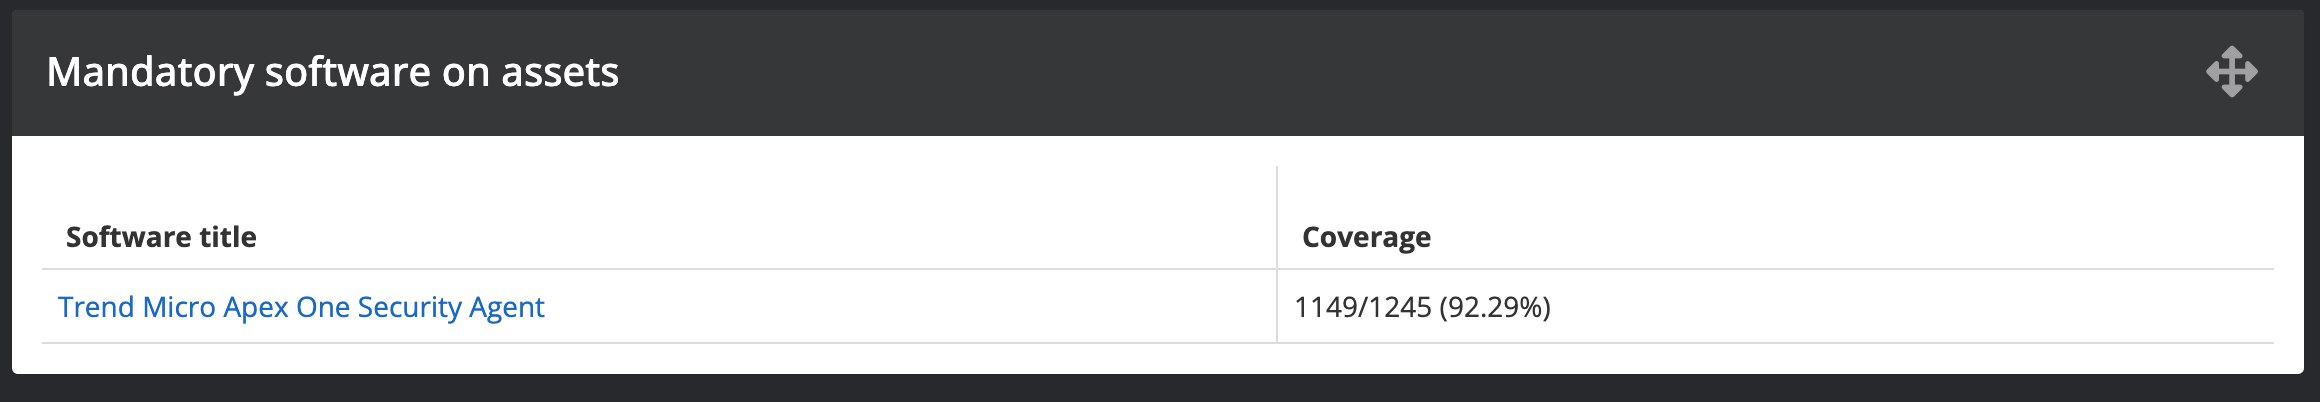
Mandatory Software
The mandatory software widgets show all defined mandatory software titles per rule setting and their asset coverage.